Beyond the dashboard: How open data powers public services across Europe
From budget transparency in Ireland to liveability in the Netherlands, discover how open datasets create value for citizens and society
Throughout Europe, public institutions are putting open data into practice to better serve citizens. Such initiatives show how open data can support modern governance by enabling citizen engagement, building trust and driving service innovation. They also demonstrate that the value of open data extends beyond its original purpose, fuelling collaboration, new insights and more responsive public services.
This data story explores three examples of how open data is powering better public services across Europe: budget transparency in Ireland, environmental monitoring of drinking water in Switzerland and liveability mapping in the Netherlands.
Ireland – Where your money goes
Transparency in public spending has become a national priority in Ireland, as outlined in the Member State’s public spending code, the framework for evaluating, planning and managing public spending. In line with this commitment, the Irish government launched the open data initiative called where your money goes. This initiative provides an interactive dashboard that visualises how public funds are allocated across departments such as health, education and housing.
Here, we explore the underlying dataset that shows government spending across sectors from 1994 to 2022 to analyse historical shifts (Figure 1). These visualisations show how Ireland has undergone changes in its spending priorities over the past three decades.
In 1994, the largest portions of the budget went to the Department of Justice (11.7 %), the Department of Education and Youth (9.8 %) and the Department of Business, Enterprise and Innovation (9 %). By 2001, there was a rise in funding for the Department of Tourism, Culture, Arts, Gaeltacht, Sport and Media, which increased from below 5 % to around 7 %, and the Department of the Environment, Climate and Communications, which climbed from 5 % to 8 %.
A significant shift occurred in 2008, amid the financial crisis, when funding for the Department of Justice surged to 17 %, and the Department of Health spending rose steadily – from just 3.0 % in 2001 to 10.7 % by 2008. In 2015, funding for the newly introduced Department of Public Expenditure, NDP Delivery and Reform reached 13.9 %, while the Department of Tourism, Culture, Arts, Gaeltacht, Sport and Media rebounded from a post-2008 dip to account for 10.6 % of public expenditure. Most recently, by 2022 the Department of Housing, Local Government and Heritage had become a key area of spending, representing 11.1 % of net expenditure, while the Department of Public Expenditure, NDP Delivery and Reform maintained a high share at 10.3 %. This analysis illustrates how open data can help uncover long-term trends in policy shifts and reveal how government priorities have evolved over time. View the dashboard or explore the dataset to discover more cross-sectoral comparisons and possible reuse opportunities regarding public spending data.
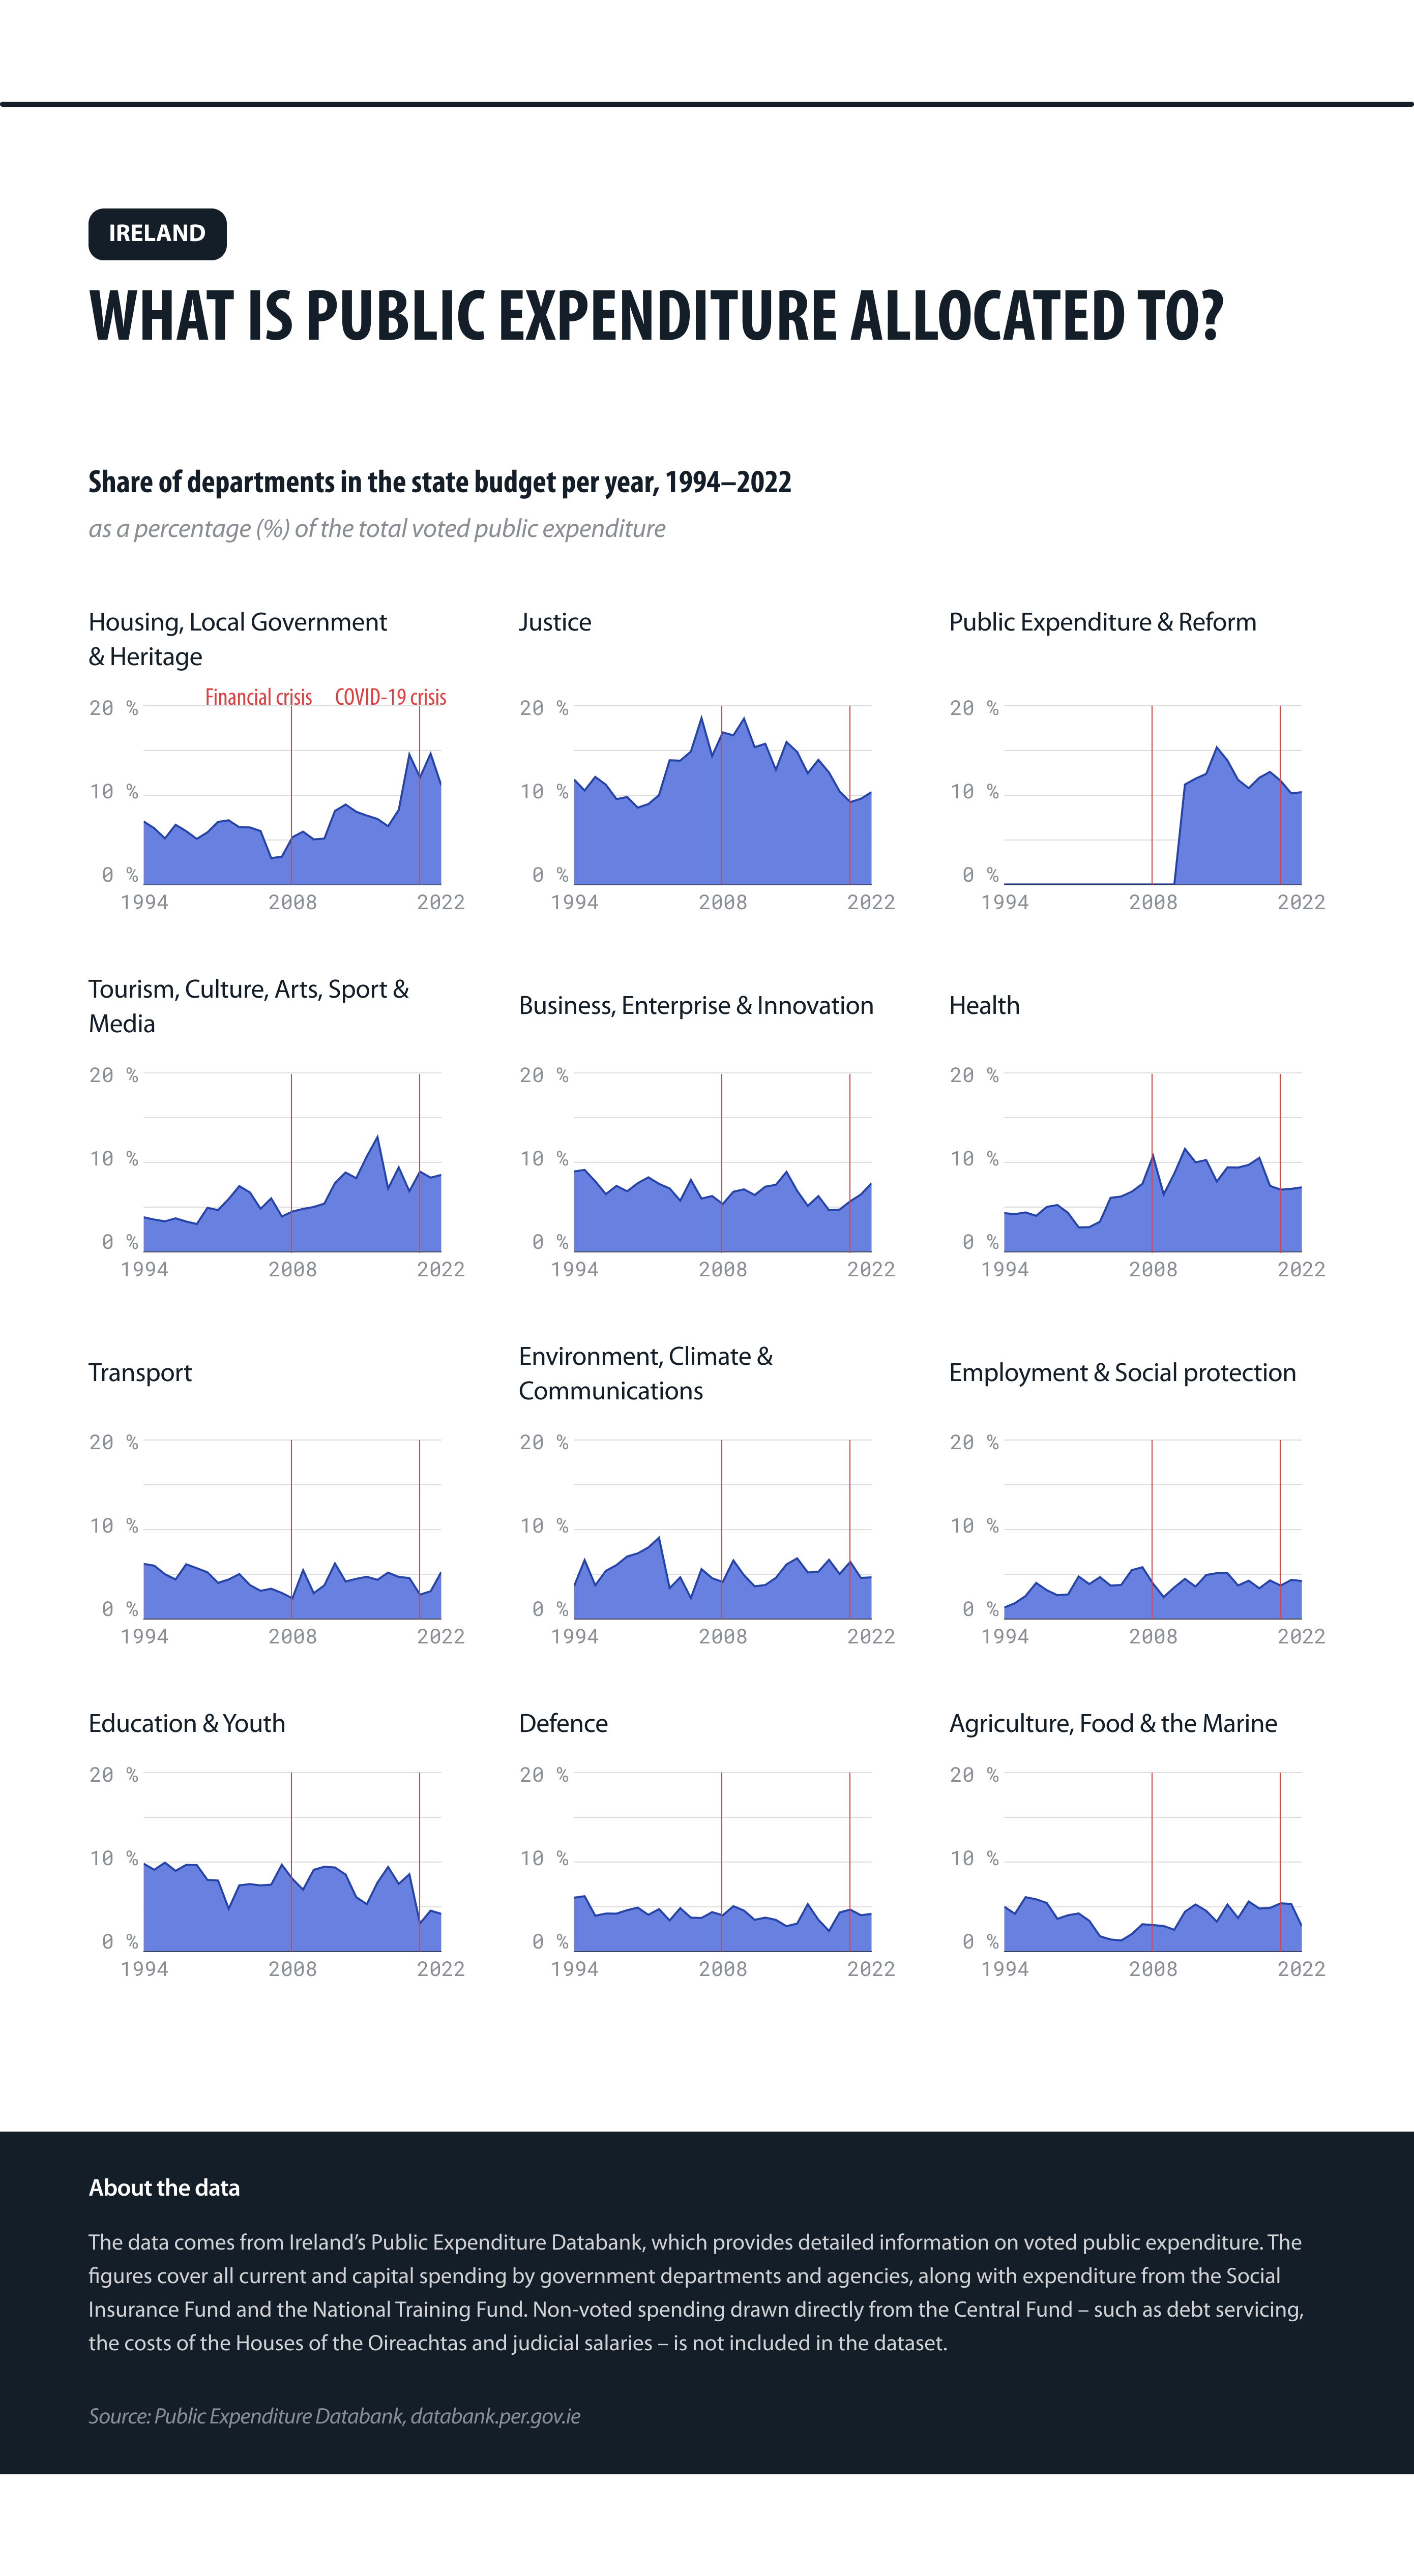
Figure 1: How did Ireland’s public expenditure evolve over the last 30 years?
Source: Data.europa.eu and the Department of Public Expenditure, NDP Delivery and Reform.
Switzerland – Safeguarding water quality with open data
Open data also plays a vital role in ensuring the quality of essential services. In Switzerland, one such case is the monitoring of drinking water quality using publicly available data. Specifically, the canton of Zürich has developed the Züri Trinkwasser Map, an initiative that visualises water quality across the region based on openly accessible environmental monitoring data. This tool gives residents insight into the safety and composition of their drinking water, while also helping authorities comply with public health and environmental regulations.
Figure 2 explores the open dataset behind this interactive map, focusing on trends in key indicators between 2020 and 2024. The dataset includes measurements of a wide range of substances that impact water quality. Among the indicators, nitrate levels and water hardness remained largely stable. Most other substances also fell within safe limits. However, two exceptions stand out: chlorothalonil R471811, a pesticide residue, and trifluoroacetic acid, an industrial by-product.
For chlorothalonil R471811, the share of samples showing elevated levels rose from around 30 % in 2020 to nearly 50 % in 2021, before declining to 25 % by 2024. Trifluoroacetic acid, which has been monitored since 2021, presents a more complex picture: fewer than 20 % of samples were rated ‘very good’, most fell into the ‘OK’ range and around 20 % approached critical levels – a proportion that has gradually increased over time.
This analysis shows how open data can support the early detection of potential risks and timely policy interventions. Explore the map or analyse the dataset to uncover more about how drinkable the water is in Zürich.

Figure 2: Key water quality indicators in Zürich
Source: Data.europa.eu and the City of Zürich.
The Netherlands – Measuring what makes cities liveable
What makes a city a good place to live? In the Netherlands, open data is helping policymakers – and the public – explore this question. Through its Leefbaarometer (liveability barometer), the Dutch government collects and shares data on key factors that influence quality of life, such as housing, environment and safety. This information is combined into a national map that provides an overview of the liveability of different areas of the Netherlands.
Figure 3 presents an analysis based on the Leefbaarometer data, examining long-term developments across the Member State. The analysis groups liveability changes by their intensity to define categories, allowing us to explore what kind of changes are being experienced and by how many people.
The data shows that overall liveability improved for nearly all (93.9 %) Dutch citizens between 2014 and 2022. However, looking at individual dimensions reveals a more nuanced picture. For 69.5 % of citizens, the physical environment improved during this period. This includes objective indicators such as green space, noise levels and air quality. The degree of improvement varied, with the largest share of inhabitants reporting small increases (29.5 %), followed by medium to moderate increases (23.4 %).
A similar trend is seen in the areas of nuisance and safety, where 77.7 % of citizens experienced positive changes, based on indicators such as reduced crime rates and enhanced traffic safety. The largest share of inhabitants reported a very significant increase (29.9 %) in the liveability score in this area, followed by a large increase (21.9 %).
In contrast, the social cohesion dimension declined for most Dutch citizens (72.6 %). This dimension includes indicators such as residential stability and neighbourhood connectedness. Around half of people (49.6 %) experienced a small decrease in the liveability score in this area. Meanwhile, access to facilities and services as well as the quality of housing stock improved for a large majority of inhabitants – 84.6 % and 96.9 %, respectively – with most inhabitants scoring in the higher improvement brackets.
By breaking down model-based liveability estimates into interpretable categories, policymakers and researchers can identify broader trends and areas that may require local attention. To understand how other indicators of liveability have evolved over time, explore the dashboard or dive into the original data.

Figure 3: Changes in liveability in the Netherlands
Source: Data.europa.eu and the Leefbaarometer.
Conclusion
The power of open data lies not only in its initial application, but in its potential for reuse. When made available in accessible formats, open datasets can support new analysis, inspire service improvements and enable better public understanding of complex issues.
The three examples described in this data story show how this works in practice. In Ireland, open data on public expenditure provides insights into shifting government priorities over decades, helping both citizens and policymakers understand how national needs evolve. This demonstrates how financial transparency not only strengthens trust, but also fosters a more informed public debate around spending decisions.
Meanwhile, in Switzerland, water quality data allows for the early detection of pollutants, ensuring timely public health interventions and reinforcing trust in environmental monitoring. This highlights how open data can play a critical role in safeguarding essential services and maintaining high environmental standards.
In the Netherlands, liveability data reveals steady progress in areas like housing and safety, while also drawing attention to persistent challenges such as declining social cohesion, offering guidance for targeted urban improvements. This illustrates how open data supports balanced, long-term planning by helping policymakers align national progress with local needs.
Explore more open data initiatives at data.europa.eu and subscribe to our newsletter for the latest updates.